User Guide
Traceability Matrix
A visual map linking features to stories to test cases with coverage statistics — for audits, compliance, and stakeholder reporting.
What the traceability matrix shows
The traceability matrix gives a complete picture of how a feature's stories are covered by test cases. It answers the questions:
- Which stories have no test cases yet?
- What percentage of stories are fully covered?
- Which test cases are approved vs pending?
Accessing the matrix
Navigate to Traceability in the sidebar, then select a feature from the dropdown. The matrix renders immediately showing all rows.
Reading the matrix
Each row in the matrix represents one story. Columns show the linked test cases with their format and status badges. The header bar shows aggregate coverage stats:
- Stories with test cases — number and percentage of stories that have at least one test case.
- Stories without test cases — gaps in coverage requiring attention.
- Total test cases — across all stories in the feature.
- Approved test cases — ready for execution or export.
Exporting the matrix
Click Export CSV to download the full matrix as a spreadsheet. The export includes:
- Story title and status
- Test case title, format, and status for each linked case
- Coverage summary row at the end
This format is suitable for attaching to compliance reports, sprint reviews, or handing off to external QA teams.
Tip: Use the traceability matrix as a pre-sprint checklist. Stories without test cases that are going into the next sprint are a signal to generate test cases before development begins.
Example coverage map
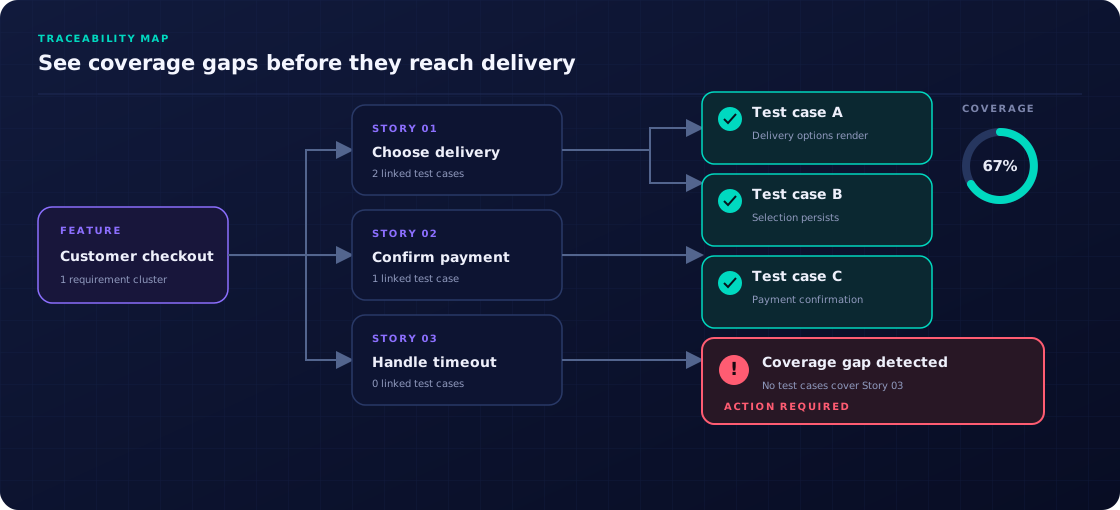
Story 3 has no test coverage — a gap the matrix immediately surfaces